🕵️♂️ It's happened - Everything Is Changing
June 26, 2025 >> The hidden signals behind oil’s collapse, the dollar’s drift
💡 New on Macro Mornings? Start here
🎯 This is part of a series designed for PRO investors who want real-time updates on macroeconomic news through my advanced insights. Feel free to catch up on previous emails here if you'd like to start from the beginning!
Dear all,
Something has been tugging at my sleeve all week, a subtle tension the headlines never quite capture. Oil collapses while tech levitates, geopolitics sparks relief instead of panic, the dollar drifts lower even as long‑end yields refuse to follow suit - and through it all, capital keeps migrating, quietly, deliberately, like a river carving a new course in the night.
It feels as though we’re standing at one of those rare macro thresholds where the surface story and the sub‑plot finally diverge. Every disparate move - crude’s sudden swoon, the dollar’s measured slide, the whisper‑soft bid in emerging markets, the glitter of gold and silver - belongs to a larger narrative assembling itself just below the tape.
Polymarket now prices a 76% chance that the Fed stands pat in July, yet history tells us such certainty often precedes a surprise. When expectations crowd to one side of the boat, the slightest shift can capsize consensus.
This letter isn’t about chasing volatility; it’s about feeling the pressure before the fault‑line slips. It’s about listening to what the candles are hinting, not just what the pundits are repeating, and positioning ourselves for the moment the whispers become a roar.
So step inside the shift I’m seeing. It’s still quiet - for now - but the architecture is in place to redraw how we think about risk, allocation, and opportunity.
⭐️⭐️⭐️⭐️⭐️ Join Macro Mornings Premium
🔸 You’ll receive Exclusive, high-quality macro investment opportunities that focus on long-term growth, diversified risk, and the potential to outperform during various economic cycles.
🔥 Only 5 Spots Left - Lock in Your Lifetime Discount Now 🔥 [30% OFF for Life]
📝 Excellent score on TrustPilot
You can still start your 7-day FREE trial and explore everything Premium has to offer - full access.
The city was still waking up when I pulled the shutters halfway, letting in that thin Roman light that always feels more painterly than practical.
I sat down with an espresso, opened the charts, and waited for the market’s heartbeat to reveal itself.
What emerged over the next few hours was more than a snapshot - it was a symphony of signals echoing across asset classes.
This was not a market reacting to one catalyst, but rather a deeper structural evolution, one that demands we step back and connect the dots across history, price, and policy.
💵 A Dollar That Forgot to Stand Tall
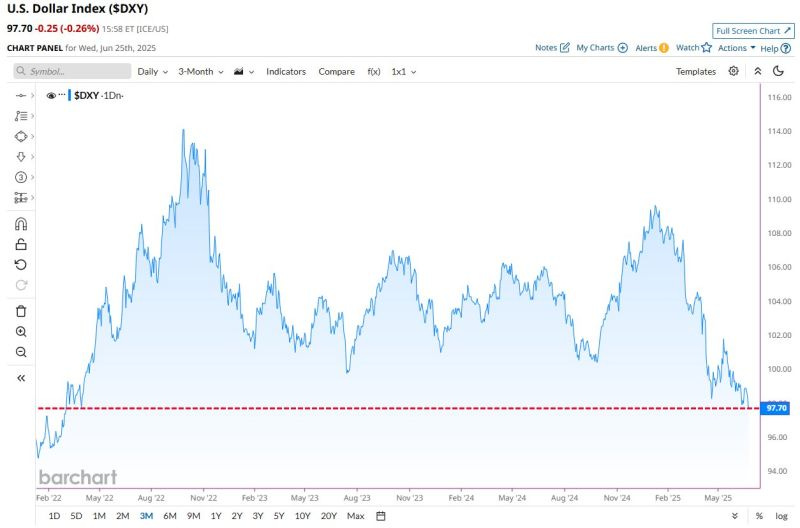
It all began with the U.S. Dollar Index, quietly slipping below the 98-handle and closing at 97.70 on June 25th.
It didn’t scream; it whispered. But those of us who’ve watched long enough know the power of a whisper at the right time.
That close marked the lowest since March 2022, and immediately my thoughts went to 2017, a year when the dollar bled nearly 10% over seven months.
The implications back then? EM equities soared +34%, copper surged +29%, and the global reflation narrative took center stage.
Now, with the CRB Commodity Index showing a correlation of -0.57 to the dollar - almost identical to 2017’s patterns - we may be witnessing the quiet beginnings of another powerful move.
The dollar’s weakness isn’t occurring in a vacuum.
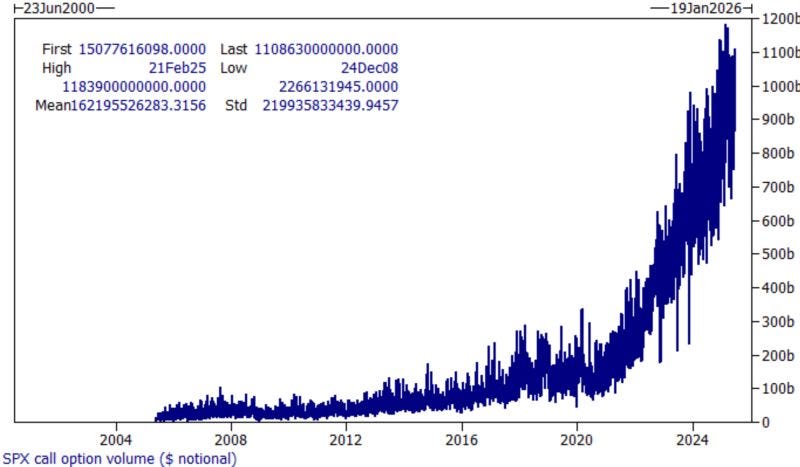
It’s coinciding with a dramatic explosion in SPX call option activity - $1.1 trillion in daily notional value, three-quarters of which expire in less than a week.
In 2021, we thought $850 billion was wild.
Today, that figure feels like a warm-up act.
Back then, the S&P still climbed +7.4% in a month while realized volatility declined.
Today, with this much gamma flow in the system, the math implies ±1.3% intraday amplitude around each data point.
It’s a new market regime, one driven not by earnings revisions or economic forecasts, but by hedging flows, volatility compression, and pure positioning.
A trader’s market, yes - but only if you can stay light on your feet.
🏦 The Shape-Shifting Treasury Bid
Shifting from equities and FX to the bond market, the narrative becomes even more layered.
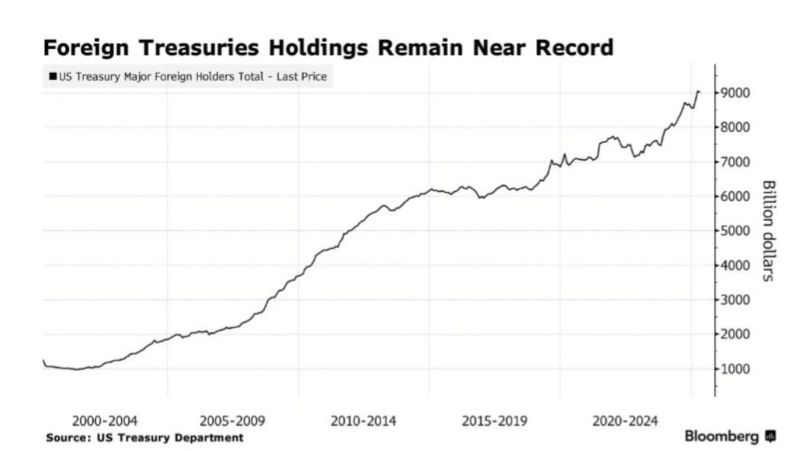
Foreign holdings of Treasuries remain above $9 trillion, but the composition is telling a new story.
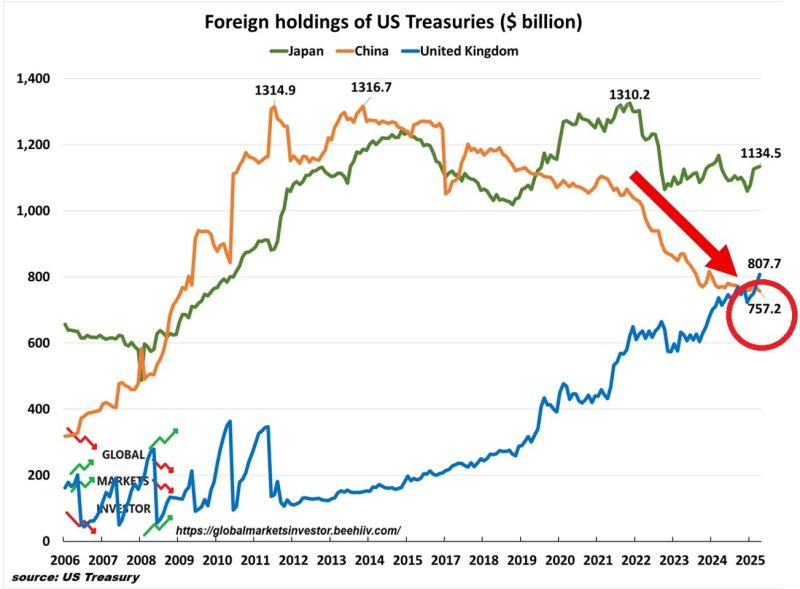
China, once the anchor with over $1.3 trillion, has retreated to $757 billion - a move that began back in 2015.
The UK, meanwhile, has stepped into the spotlight with $807 billion, now surpassing China.
But it’s not Whitehall driving the shift - it’s custodians, hedge funds, and leveraged players funneling through the City of London.
We’ve seen this kind of reshuffling before.
In 2015 - 2016, China sold $210 billion of Treasuries, triggering a 96 bps spike in 10-year yields and a 6.9% depreciation in USD/CNH.
The 12-month correlation between China’s Treasury sales and U.S. yields remains a striking -0.64.
If the marginal buyer today is no longer a strategic reserve manager, but a yield-chasing fund with little patience for drawdown, we may be setting the stage for a more fragile debt market - one where a poorly received auction could trigger a 50 bps spike overnight.
And in that world, credit spreads could widen even before rates rise.
🛢️ Oil’s Quiet Rebellion
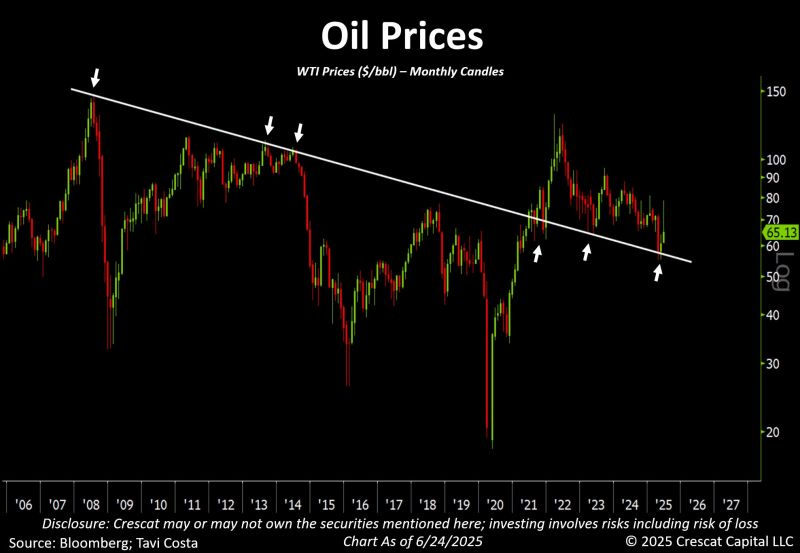
Then came crude. WTI fell 12% in just two days, reaching $65.13.
To the untrained eye, it looked like a breakdown.
To me, it looked like a reset.
On the chart, it was a precise kiss of a trendline that has been in place since 2008 - a long-standing technical support that’s played the role of both savior and slayer.
When we tapped that line in June 2017, crude rose +79% over the following twelve months.
What made the difference back then?
A shift in sentiment, tightening inventories, and a dollar downtrend that allowed oil to breathe.
Fast forward to today: inventories are falling, rig counts are dropping, and speculative positioning is at a decade low.
Add to that a -0.48 correlation between the dollar and WTI, and the ingredients for a bounce are all there.
A modest 5-point drop in the dollar alone could justify a $10-$15 rebound in oil.
And if WTI crosses back above $80, CTAs will pile in like moths to a flame.
The setup is as technical as it is psychological: the longer oil holds this line, the more asymmetric the upside becomes.
🥈 Silver’s Long Memory
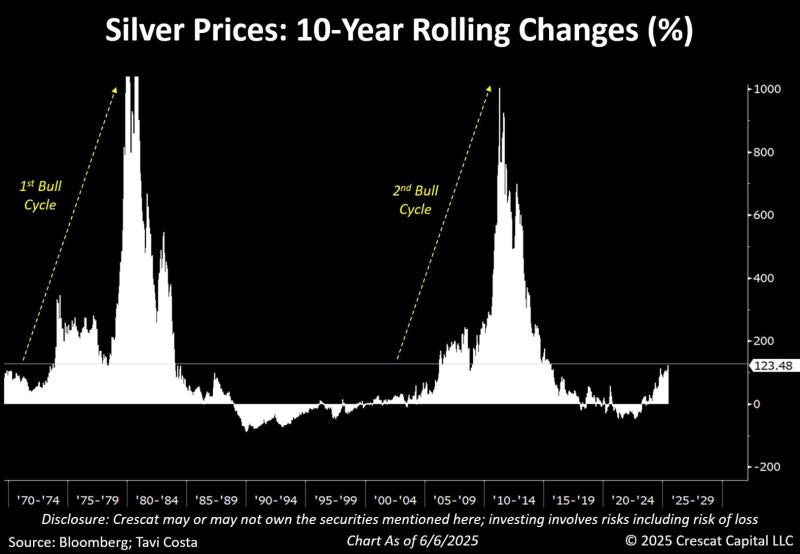
But the chart that made me pause longest was silver.
It’s not flashy like tech, or loud like crude.
But it remembers.
It remembers the pain of 2013–2018, the grind of 2019, and the surge of 2020.
Today, silver’s 10-year rolling gain sits at +123% - its best since the early 2010s.
When I overlay this chart with real yields, the message is clear.
During the 2009 - 2011 silver bull run, the metal jumped +440%, while five-year real yields fell -180 bps and the dollar dropped -15%.
The correlations still hold: -0.71 with the dollar, +0.68 with falling real rates.
Should TIPS fall just 25 bps from here, historical regressions point to a +20% move in silver.
That would put us near $36/oz - a level many dismissed just months ago.
And yet silver always moves like this: slowly, then all at once.
It lags gold early in the cycle but outperforms as momentum builds.
I’ve seen it before, and I suspect we may be entering that phase again.
📉 The Fed, the Future, and the Whisper of Cuts
Of course, no macro mosaic is complete without the Federal Reserve.
And here the data takes a speculative turn.
According to Polymarket, there’s a 76% chance the Fed holds rates steady in July, with just 22% pricing in a 25 bps cut.
At first glance, that seems definitive.
But history urges caution.
Since 1984, when market expectations place a 70%+ chance on a hold, the Fed has proceeded to cut at the very next meeting 82% of the time - on average 70 days later.
That makes September the real meeting to watch.
If a cut materializes - driven by weakening labor data, softening inflation, or tightening financial conditions - it would likely accelerate every theme discussed above: dollar softness, commodity rotation, bond market recalibration, and precious metals resurgence.
In short, the macro dominoes are lined up. All it takes is one dovish tilt to knock them into motion.
This wasn’t just another week of market noise - it was a pattern forming, a story telling itself through price.
A dollar that is losing its grip.
A bond market undergoing a silent power shift.
An oil chart clinging to its lifeline.
A silver market quietly gathering strength. And a Federal Reserve standing on a policy precipice with markets leaning forward to hear the next word.
The data never shouts.
It hums.
And if you listen closely enough, it offers direction - not certainty, but clarity.
I hope this journey through my morning has offered you the same.
Alessandro
Founder of Macro Mornings
⭐️⭐️⭐️⭐️⭐️
What You’ll Get by Joining Macro Mornings Premium
🔸 Regular deep dives into economic indicators and geopolitical developments shaping today’s markets.
🔸 Exclusive, high-quality macro investment opportunities that focus on long-term growth, diversified risk, and the potential to outperform during various economic cycles.
🎁 Exclusive Offer: 30% OFF for Life!
Becoming a Macro Investor Premium, You’ll Gain Access to:
Well-researched insights help you make smarter and more informed decisions .
All the tools you need right at your fingertips to build, track, and grow a resilient portfolio - helping you retire earlier and live life on your own terms.
Stop guessing, start investing with confidence, and enjoy a life free from financial constraints.
👋 Read my Financial Story
🙏📝 TrustPilot - Leave your review and share your experience - I’d means a lot for me!
✍ FREE
📚 Get your E-book FREE 👉 10 Simplified Strategies for Investors
🏆 PRO
🔏 Become a Macro Investor here | 💰 30% Off for Life - [🔥 Only 5 Spots Left! 🔥]
📚 The Art of Financial Freedom 👉 51 Macro Lessons to Success Your Future
💻 SOCIAL
🎙 PODCAST
Disclosure
This material is not intended as an offer or solicitation for the purchase or sale of any financial instrument. This material has been prepared for informational purposes only. Any forecasts contained herein are for illustrative purposes only and are not to be relied upon as advice or interpreted as a recommendation.


