⚡ This week’s economic calendar presents several key indicators that provide insights into the current state and future trajectory of the economy ⚡
📢 Bonus to must read FOR INVESTORS
⚡ ISM Manufacturing PMI ⚡
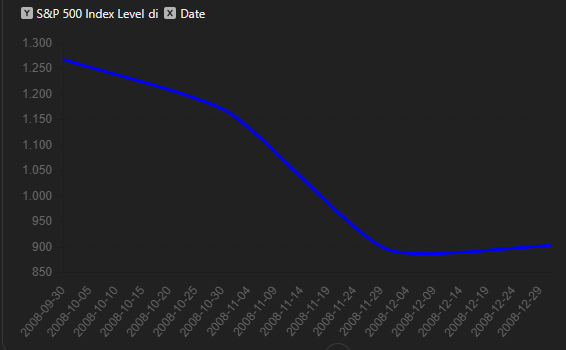
The current figure of 48.5 indicates contraction. Historically, similar contractions were observed in early 2020 and late 2008, often preceding broader economic slowdowns. During these periods, equity markets, particularly the S&P 500, experienced significant volatility and declines. For instance, in late 2008, the S&P 500 dropped by nearly 30% in a matter of months as manufacturing activity contracted.
🧠 Steady Eurozone Inflation 🧠
A YoY increase of 2.5% is relatively stable, reminiscent of early 2019 figures. This level of inflation typically reflects moderate economic growth without significant overheating, potentially supporting steady ECB policies. Historically, stable inflation rates in the Eurozone have been associated with moderate bond yield movements and a relatively stable EUR/USD cross. For example, in early 2019, the EUR/USD maintained a range between 1.10 and 1.15.
💎 Job Market Data 💎
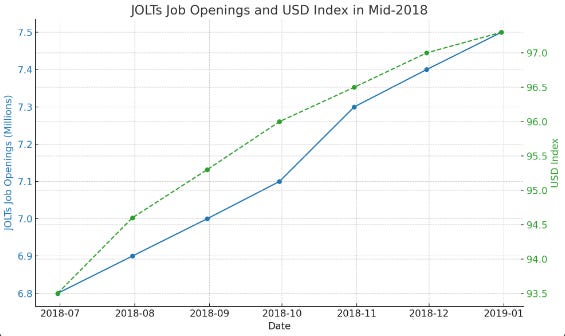
Job Boom: Surged to 8.140M, suggesting strong labor demand. Historically, high job openings correlate with a stronger USD due to anticipated interest rate hikes by the Federal Reserve. In mid-2018, a similar surge in job openings saw the USD index rise by nearly 5%.
Layoff Signals: Increased to 238K, indicating a rise in layoffs. During periods of rising jobless claims, such as in early 2009, bond yields often fell as investors sought safer assets. The 10-year Treasury yield dropped from over 2.5% to below 2% in early 2009 as jobless claims increased.
🔔 Oil Market Shocks 🔔
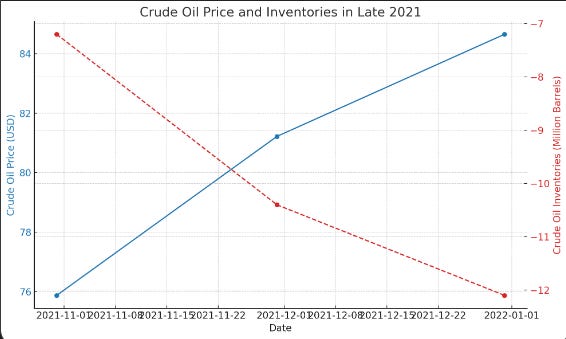
A substantial drop of -12.157M barrels can influence energy markets. Historically, sharp declines have led to increased oil prices, as seen in mid-2008 and late 2021. For instance, in late 2021, crude oil prices surged by over 15% in a month following significant inventory drawdowns. The performance of energy sector ETFs and indices could be directly impacted, often resulting in gains.
💥 Easing Manufacturing Prices 💥
A drop to 52.1 might signal easing inflation pressures in the manufacturing sector. Historically, easing price pressures have led to lower bond yields and influenced Fed policy expectations. For example, in late 2013, easing price pressures contributed to a decline in the 10-year Treasury yield from 3% to 2.5%.
⚡ Job Growth Trends ⚡
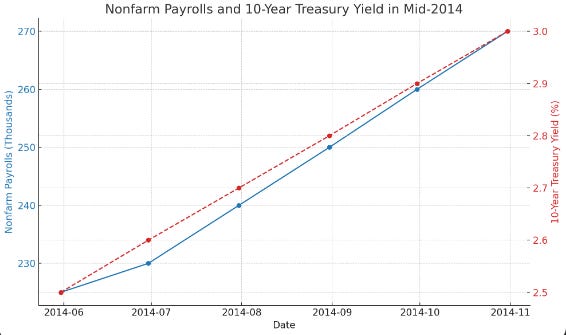
The addition of 206K jobs, while higher than expected, shows a slight cooling from the previous month's 218K, potentially reflecting a moderating labor market. Historically, strong payroll figures support equity markets but can lead to higher bond yields due to inflationary concerns. In mid-2014, strong payroll data pushed the S&P 500 up by 10% over six months.
💎 Rising Unemployment Caution 💎
The slight increase to 4.1% warrants attention as it may indicate early signs of labor market slack. Historically, rising unemployment rates have been associated with lower bond yields and mixed impacts on equity markets depending on the broader economic context. For instance, in early 2016, a rising unemployment rate led to a temporary decline in the S&P 500, while bond yields also fell.
Best regards,
Alessandro
Founder of Macro Mornings
📆 ECONOMIC CALENDAR
Monday, July 1, 2024
S&P Global US Manufacturing PMI (Jun): 51.6 (Forecast: 51.7; Previous: 51.3)
ISM Manufacturing PMI (Jun): 48.5 (Forecast: 49.2; Previous: 48.7)
ISM Manufacturing Prices (Jun): 52.1 (Forecast: 55.8; Previous: 57.0)
Tuesday, July 2, 2024
Eurozone CPI (YoY) (Jun) Preliminary: 2.5% (Forecast: 2.5%; Previous: 2.6%)
JOLTs Job Openings (May): 8.140M (Forecast: 7.960M; Previous: 7.919M)
Wednesday, July 3, 2024
ADP Nonfarm Employment Change (Jun): 150K (Forecast: 163K; Previous: 157K)
Initial Jobless Claims: 238K (Forecast: 234K; Previous: 234K)
S&P Global Services PMI (Jun): 55.3 (Forecast: 55.1; Previous: 54.8)
ISM Non-Manufacturing PMI (Jun): 48.8 (Forecast: 52.6; Previous: 53.8)
ISM Non-Manufacturing Prices (Jun): 56.3 (Forecast: 56.7; Previous: 58.1)
Crude Oil Inventories: -12.157M (Forecast: -0.400M; Previous: 3.591M)
Friday, July 5, 2024
Nonfarm Payrolls (Jun): 206K (Forecast: 191K; Previous: 218K)
Unemployment Rate (Jun): 4.1% (Forecast: 4.0%; Previous: 4.0%)
Disclosure
This material is not intended as an offer or solicitation for the purchase or sale of any financial instrument. This material has been prepared for informational purposes only. Any forecasts contained herein are for illustrative purposes only and are not to be relied upon as advice or interpreted as a recommendation.


